Camps Dashboard
Hover over the camps module and click on Camps Dashboard to view the overall analytics of the camps.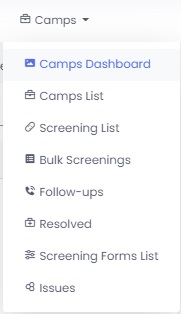
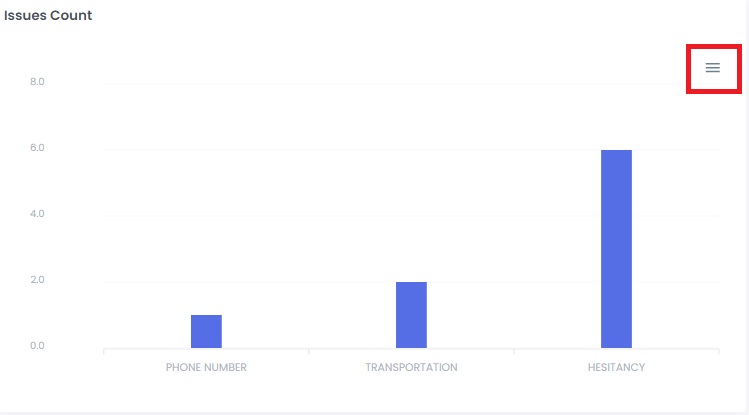
The dashboard consists of Risk analysis, Screening count and Issues count in graphical representation.
RISK ANALYSIS shows overall analysis of risks (low, medium, high and no risk) recorded during camps. It can also be filtered according to location by the option provided.

The SCREENING COUNT represents the number of participants screened in a particular City.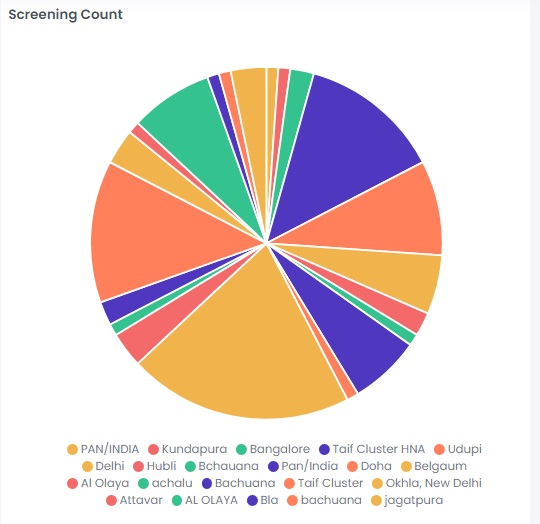
ISSUES RAISED show a graphical representation of overall issues raised during the camp. The data can be downloaded as a file by the option provided.